When a customer asks "did your system receive my event?" the answer should be a three-click investigation, not a three-day forensic exercise. That's what observability for webhook delivery actually means: knowing what arrived, what was attempted, what succeeded, and what failed — without grepping logs.
This guide covers the four signals every webhook system should expose, how to instrument them, the drain pattern that ties them into your existing observability stack, and the alerts that matter.
The four signals
Every webhook delivery has four observable points. Get all four; you can answer almost any question about delivery state.
1. Ingest. What did the system receive? Source IP, headers, payload size, signature verified or not, timestamp. This is the "did the event arrive at all" signal.
2. Routing. Which rule selected the destination, what destination snapshot was resolved, and which transform was applied. This is the "did the event go where I expected" signal.
3. Attempts. Each delivery attempt: target URL, status code, latency, response body (truncated), error if any. This is the "what happened on the way out" signal.
4. Lifecycle. Status transitions per delivery: queued, in-flight, succeeded, failed, dead-lettered, replayed. This is the "what's the current state" signal.
A delivery history that captures all four is the floor of webhook observability. Without it, you're debugging by inference. With it, every customer question has a deterministic answer.
Where the signals live
Three storage layers, each with different retention and query characteristics:
- Hot storage for the retained window: detailed per-delivery records, retained payload snapshots, every attempt, outbound request headers, and response previews. Queryable in the dashboard.
- Warm storage for the last few months: aggregated rollups (delivery counts by status, by destination, by hour). Queryable for trends.
- Cold storage for archival: raw events streamed out via drains to your data lake or audit system.
Hooksbase does this natively: delivery history retention ranges from 7 to 30 days by tier, payload retention ranges from 3 to 14 days by tier, hourly aggregates are retained for 90 days, and Pro+ event drains let you keep lifecycle telemetry downstream for whatever retention policy you need.
Event drains: pipe webhook telemetry into your observability stack
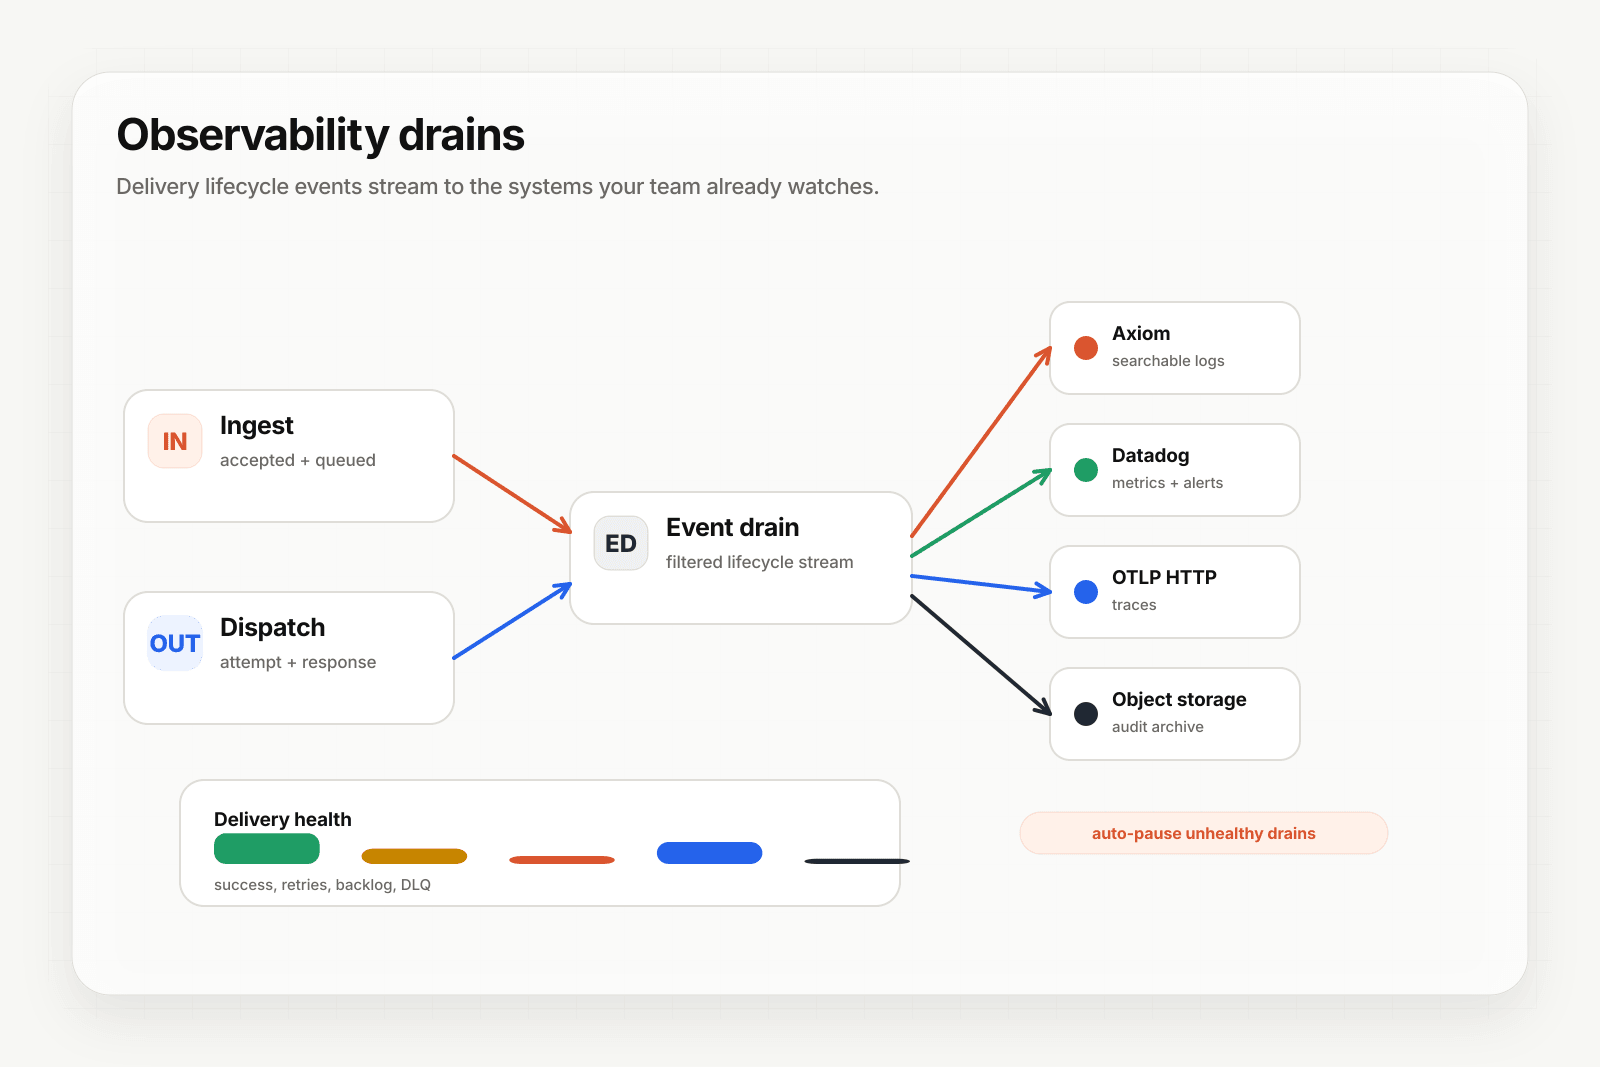
Most teams already have an observability stack — Datadog, New Relic, Grafana, Honeycomb, an OpenTelemetry pipeline, an SIEM. Webhook delivery telemetry is most useful inside that stack, alongside everything else, not in a separate dashboard.
That's what event drains do: stream webhook lifecycle events (delivery created, attempt completed, delivery succeeded, delivery failed, DLQ entry) to an external sink in real time. Your existing dashboards add panels for webhook delivery; your existing alert rules trigger on webhook anomalies; your existing on-call rotation handles webhook incidents.
Hooksbase supports five Pro+ drain sink types: HTTP (custom endpoints), Axiom, Datadog, S3-compatible object storage, and OTLP HTTP (any OpenTelemetry collector). The drain runs on the relay side; events flow to your sink without your application doing anything.
See Stream agent event lifecycle to your observability stack for the practical setup.
Alerts that actually matter
Most webhook alerting is too noisy or too quiet. The alerts worth firing:
1. Terminal-failure spike — fire when terminal failures (events going to DLQ) exceed a baseline rate. Catches deployment regressions and provider-side incidents.
2. Destination-health degradation — fire when one destination's success rate drops while others stay healthy. Catches broken individual endpoints (versus systemic issues).
3. Backlog growth — fire when the queue depth grows faster than it's draining. Catches throughput problems before they become outages.
4. SLO breach — fire when delivery time-to-success exceeds your defined SLO for a sustained period. Catches latency regressions.
5. DLQ accumulation — fire when DLQ size grows beyond a threshold or when entries age past a threshold without being addressed. Catches forgotten failure surfaces.
6. Quota threshold — fire when monthly or rate quotas approach the limit. Catches billing surprises and capacity planning gaps.
7. Secret lifecycle — fire when signing secrets approach expiration or rotation windows. Catches integration outages caused by expired credentials.
Hooksbase ships these Pro+ alerts as configurable rules; you set the thresholds, you pick where the notifications go. Most teams pipe the alerts into the same channel their on-call already watches.
Distinguishing customer-facing from internal observability
A subtle but important point: webhook observability serves two audiences.
Internal team: engineers debugging issues, on-call responding to alerts, SREs planning capacity. They need detailed per-attempt logs, distribution histograms, and cross-destination comparisons.
Customer-facing: the customer asking "did you get my event?" or "why didn't your system act on this?" They need a clear answer, not a metrics dashboard.
A good webhook observability surface gives both. The internal team gets everything via drains and dashboards; the customer-facing surface gives a per-event status that support can read out without escalating to engineering.
Avoid the anti-pattern: log-only observability
Many teams "have observability" because they log every webhook attempt. This is the worst of both worlds: enough data to debug if you know exactly what to grep for, not enough structure to alert or visualize.
The shift that pays off: from "log everything, search later" to "structured events with explicit fields, exposed as metrics and traces." Same data; different shape; massively faster to query.
Webhook delivery is structured by nature — every event has the same set of fields (source, destination, attempt, status, latency). It deserves to be modeled as data, not as log lines.
Where to go next
- Stream agent event lifecycle to your observability stack for the practical drain setup
- Webhook DLQs: design and recovery patterns for the failure-recovery side
- The agent production readiness checklist for the full pre-launch list
- Event-driven architecture for AI agents for the broader pattern